Previous Page
${prev-page}
Next Page
${next-page}
Data for Negotiations
Data for Negotiations
2. Key Data Trends
There are several key trends in compensation and deployment that should be considered when establishing a successful negotiation tactic. These trends tend to vary by clinical setting, so trends in a comparable setting should be considered for negotiation along with changes that could be applied to a physician’s compensation structure. The key trends are as follows:
• As shown in figure 10, ID physicians with compensation tied to performance are paid materially more than peers who are paid a straight salary.

FIGURE 10: Median Compensation by Employment Type and Compensation Plan Type (ID Physicians)
• As shown in figure 11, ID physicians with some portion of compensation tied to quality are paid materially more than peers without compensation tied to quality, regardless of employment setting, years of experience and the number of administrative roles.

FIGURE 11: Median Compensation by Employment Type and Quality Incentive (ID Physicians)
• As shown in figure 12, ID physicians formally and contractually deployed in multiple nonclinical roles are paid materially more than those who are not. This is specifically true for physicians employed by an AMC or health system due to the range of administrative roles within those organizations and the ability to negotiate due to the additional workload expected of a physician.

FIGURE 12: Median Compensation by Number of Administrative Roles (ID Physicians)
• As shown in figure 13, ID physicians providing services across multiple facilities are paid materially more than those providing services at only one facility.

FIGURE 13: Median Compensation by Number of Facilities Covered (ID Physicians)
• As shown in figures 14 and 15, women who are ID physicians earn about 16% less compensation on average than men who are ID physicians, though the magnitude of disparity varies by years of experience and employment setting.

FIGURE 14: Median Compensation by Gender and Years of Experience (ID Physicians)

FIGURE 15: Median Compensation by Gender and Employment Setting (ID Physicians)
Participation in asynchronous telemedicine does not consistently result in higher compensation. As telemedicine continues to grow in response to market regulation changes and demands, the ability to negotiate in regard to telemedicine is expected to change.”

FIGURE 16: Median Compensation: Participation in Asynchronous E-Consults Setting (ID Physicians)
• As shown in figure 17, the effective hourly rate for ID physicians’ administrative time is often far less than the contracted hourly rate. This is due to the amount of work required to fulfill administrative responsibilities often exceeding administrators’ expectations or not aligning with the FTE allocation assumed by administrator.
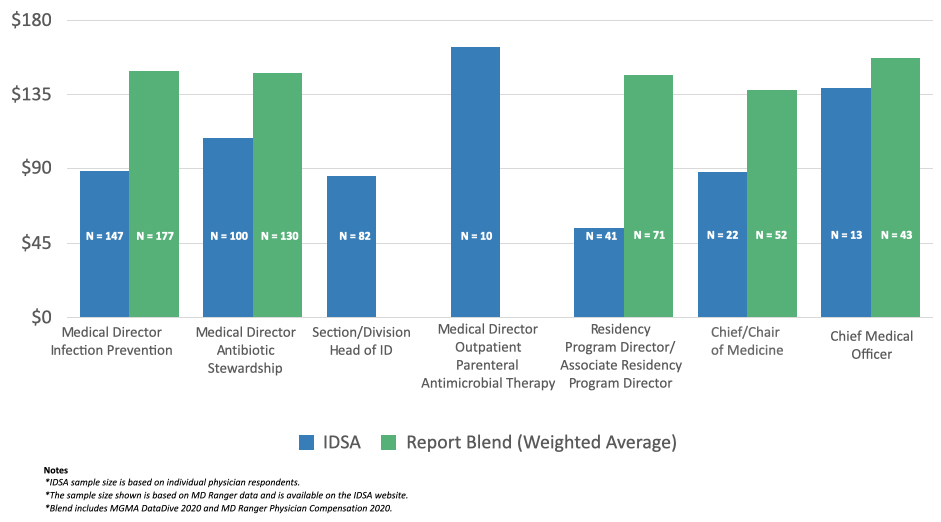
FIGURE 17: Administrative Compensation — Effective Hourly Rate (IDSA) Versus Contracted Hourly Rate (MD Ranger and MGMA Blend)